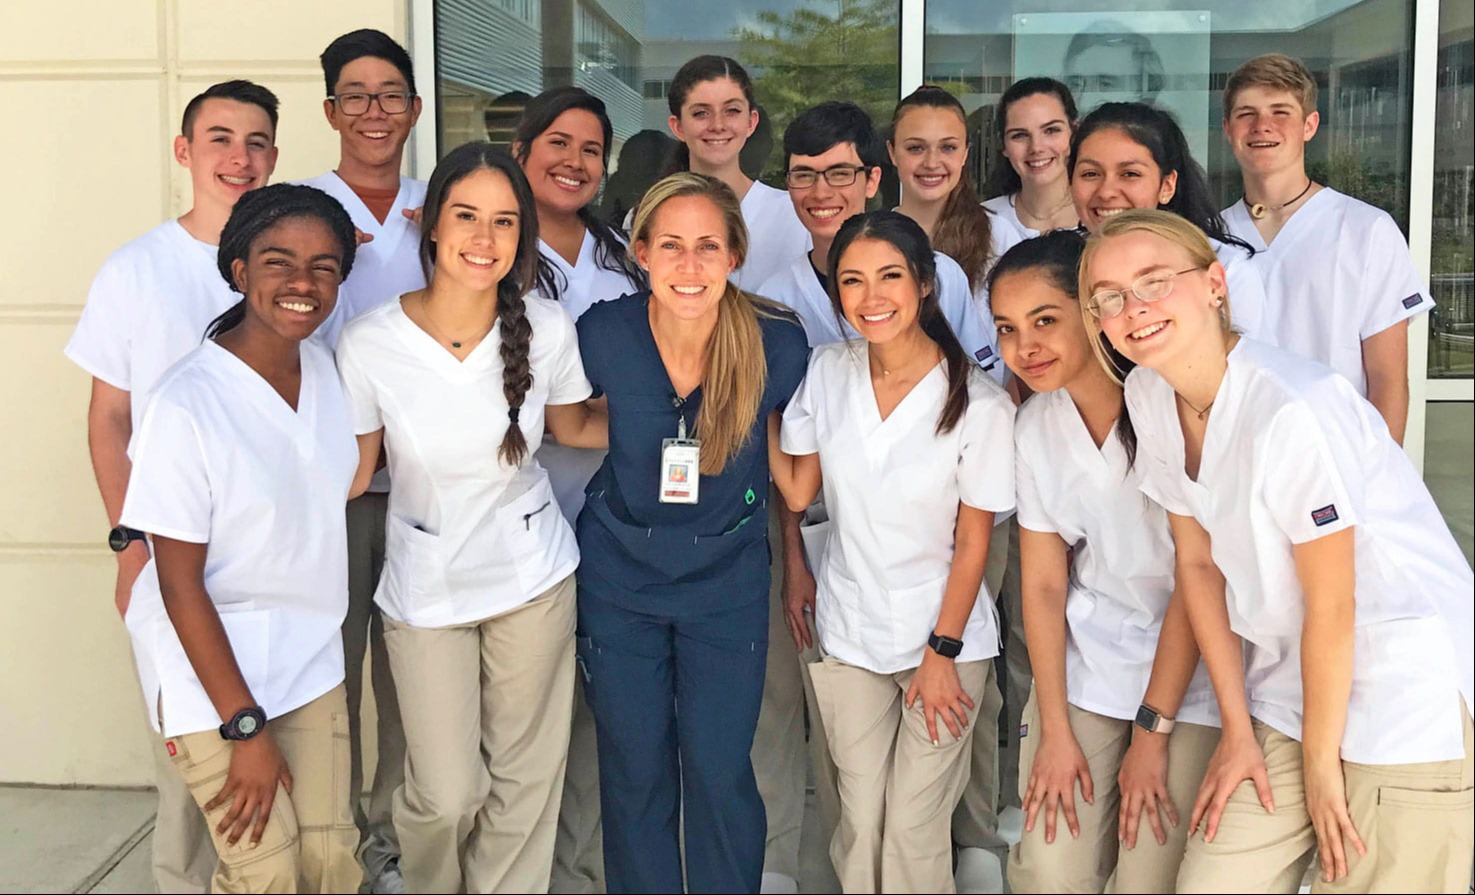
What happens at our school?
The campus-learning model guides students through an advanced curriculum at the high school and college level while providing additional resources needed to develop themselves as well-rounded individuals. Through a partnership with Austin Community College (ACC), students are given the tools to succeed while immersed in a higher education experience, beginning their freshman year of high school and ending with an associate’s degree or up to 60 hours of college credit.
We put kids first
Our educators support and build relationships with every student while providing them with the support needed to succeed at the high school and college level.
Students will have access to:
- College courses
- AVID program
- College level resources
- Transportation and food services
- Academic/emotional support
- Student clubs/organizations
- Accelerated curriculum
- Individualized goal planning
Mission
Our ECHS Owls are taught to have H.O.P.E.–faith in the premise that they can create OPPORTUNITY and a better future through EFFORT, HARD WORK and PERSONAL COURAGE. This idea of H.O.P.E. is woven into the fabric of our ECHS family.
Student Support
Students are taught study methods and organizational strategies to help them boost their academic skills. All core classes are rigorous Pre-AP and dual credit courses. Students will be challenged with a meaningful course of study and real world applications. Further student support is conducted through study halls, advisory, after school tutorials and counseling services.
Enrollment
Accountability Rating
College Readiness Scores
SAT Results (Average): 1106
ACT Results (Average): 22.7
Distinction Designations
Academic Achievement in ELA/Reading
Postsecondary Readiness
2022-23 STAAR Passing Rates
- English I – 91% 91%
- English II – 98% 98%
- Algebra I – 79% 79%
- Biology – 100% 100%
- History – 99% 99%
NOTE: STAAR results, student demographic and enrollment data is pulled from the Texas Academic Performance Report (TAPR). This page is updated generally around mid-November when the data is released by the state. The TAPR includes information from the previous school year.
2022-23 Student Demographics
- African American – 12.8% 12.8%
- Hispanic – 33.2% 33.2%
- White – 38.3% 38.3%
- American Indian – .3% 0.3%
- Asian – 12.5% 12.5%
- Pacific Islander – 0.3% 0.3%
- Two or more races – 3.1% 3.1%
- Economically Disadvantaged – 31.4% 31.4%
Student Enrollment by program
- Bilingual/ESL – 6.9% 6.9%
- Gifted and Talented – 12.2% 12.2%
- Special Education – 5.3% 5.3%
Find our Campus Improvement Plan (CIP), State and Federal Accountability summaries, School and Federal Report Cards, Texas Academic Performance Reports (TAPR), as well as the most recent climate survey results on the District Performance Indicators page.